
ACSN 2.0 Features
Hallmarks of cancer
ACSN graphically represents molecular mechanisms lying behind cancer hallmarks (Hanahan and Weinberg). ACSN exhaustively represents molecular mechanisms frequently dysregulated in cancer and in tumor microenvironment.
Curated content
The maps are manually created based on the information extracted from scientific literature and contain information about interactions between proteins, protein modifiers, post-translational modifications, protein complexes, genes, RNAs, microRNAs, small molecules and drugs. Each map covers hundreds of molecular players and reactions. Each entity on the map is annotated by references to the article and specific notes added by the map manager. Maps are curated by the specialists in the corresponding fields.
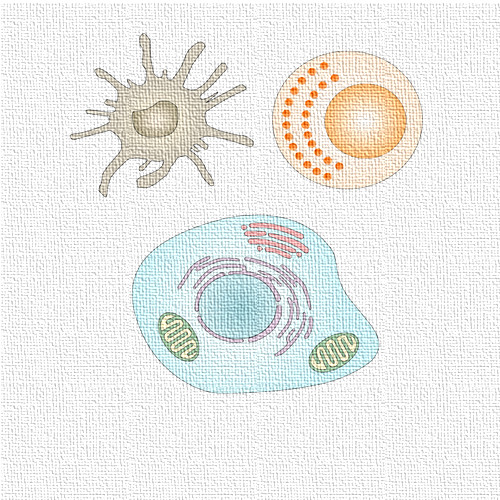
Multi-scale structure
ACSN includes cell type-specific map describing signaling in cancer cell and in different cells composing the tumor microenvironment. This information is gathered together providing a global "geographical atlas" of cancer signaling.
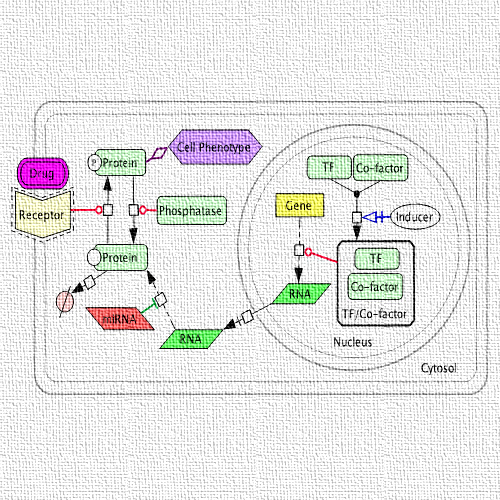
SBGN
Maps are constructed using the Systems Biology Graphical Notation standard with the CellDesigner tool. ACSN maps are reaction networks represented using process diagram description graphical language.
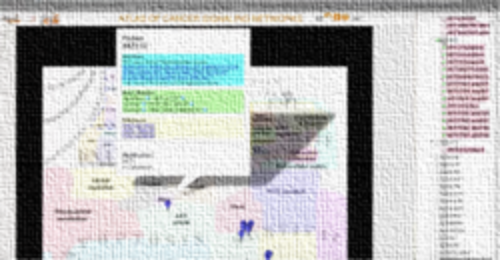
Google Maps interface
The ACSN map navigation, curation and maintenance are enabled by a user friendly Google Maps-based tool NaviCell. The tool is characterized by the unique combination of three essential features: (1) map navigation based on Google Maps engine, (2) semantic zooming for viewing different levels of details of the map and (3) integrated toolbox for data analysis and visualization in the context of ACSN.
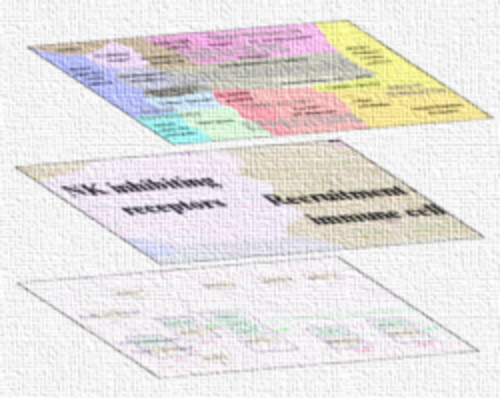
Semantic Zooming
Each level of zoom exposes a certain depth of detail. The top-level view shows the general architecture of the map. The next zoom exposes locations of known oncogenes or tumor supressors. The third zoom level adds some of the most participating proteins and complexes in the atlas. Furthermore, two zooms visualize components of the atlas and reaction edges between them. At the most detailed zoom level all details of maps are demonstrated including names of all entities, post-translational modifications, complexes' names, reaction IDs and all regulators and catalyzer of reactions.